In [1]:
%pylab inline
Populating the interactive namespace from numpy and matplotlib
Tutorial on how to use Waveform objects
A Waveform is a MadArray dedicated to handle audio signals. As such, it has a mandatory attribute fs, giving the sampling frequency of the signal.
Initialization
As for MadArray, Waveform can be initialized from a 1D nd-array with or without mask. The parameter fs should be explicitly given.
In [2]:
from madarrays import Waveform

fs = 8000
f0 = 200
f1 = 220
x_len = fs // 4
x = np.cos(2*np.pi*f0*np.arange(x_len)/fs) + np.cos(2*np.pi*f1*np.arange(x_len)/fs)
x *= np.hanning(x_len)
x /= np.max(np.abs(x))
mask = np.zeros_like(x, dtype=np.bool)
mask[int(0.4*x_len):int(0.6*x_len)] = 1

# initialization without missing samples
w = Waveform(x, fs=fs)
w.plot()
print(w)
Waveform, fs=8000Hz, length=2000, dtype=float64, 0 missing entries (0.0%)
[  0.00000000e+00   2.67312669e-06   1.02542205e-05 ...,   9.53716412e-06
   2.56356145e-06   0.00000000e+00]
In [3]:
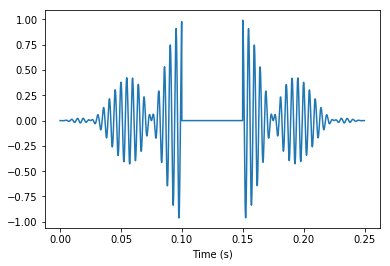
# initialization with missing samples
wm = Waveform(x, fs=fs, mask=mask)
wm.plot()
print(wm)
Waveform, fs=8000Hz, length=2000, dtype=float64, 400 missing entries (20.0%)
[  0.00000000e+00   2.67312669e-06   1.02542205e-05 ...,   9.53716412e-06
   2.56356145e-06   0.00000000e+00]

A Waveform can also be initialized from another Waveform. In this case, the parameter fs is optional.
In [4]:
wm2 = Waveform(wm)
wm2.plot()
print(wm2)
Waveform, fs=8000Hz, length=2000, dtype=float64, 400 missing entries (20.0%)
[  0.00000000e+00   2.67312669e-06   1.02542205e-05 ...,   9.53716412e-06
   2.56356145e-06   0.00000000e+00]
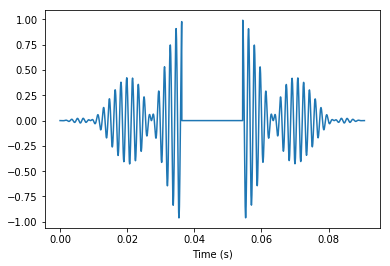
If fs is provided, the audio signal is not resampled
In [5]:
wm3 = Waveform(wm, fs=22050)
wm3.plot()
print(wm3)
Waveform, fs=22050Hz, length=2000, dtype=float64, 400 missing entries (20.0%)
[  0.00000000e+00   2.67312669e-06   1.02542205e-05 ...,   9.53716412e-06
   2.56356145e-06   0.00000000e+00]
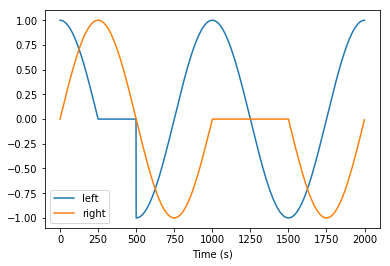
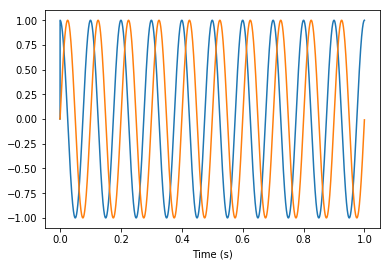
Stereo signals are handled as \(N \times 2\) arrays:
In [6]:
x_stereo = np.array([np.cos(2*np.pi*0.001*np.arange(2000)),
                     np.sin(2*np.pi*0.001*np.arange(2000))]). T
mask_stereo = np.zeros_like(x_stereo, dtype=np.bool)
mask_stereo[250:500, 0] = 1
mask_stereo[1000:1500, 1] = 1

w_stereo = Waveform(x_stereo, mask=mask_stereo, fs=1)

w_plot = w_stereo.plot()
legend(w_plot, ('left', 'right'))
print(w_stereo)
Waveform, fs=1Hz, length=2000, dtype=float64, 750 missing entries (18.8%)
[[ 1.          0.        ]
 [ 0.99998026  0.00628314]
 [ 0.99992104  0.01256604]
 ...,
 [ 0.99982235 -0.01884844]
 [ 0.99992104 -0.01256604]
 [ 0.99998026 -0.00628314]]
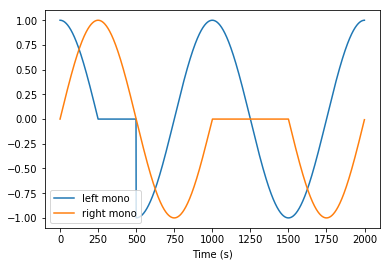
Extracting left and right channels as mono Waveform objects is easy:
In [7]:
w_left = w_stereo[:, 0]
w_right = w_stereo[:, 1]

w_left.plot(label='left mono')
w_right.plot(label='right mono')
legend()

print('Is w_left stereo?', w_left.is_stereo())
print('Is w_right stereo?', w_left.is_stereo())
print(w_left)
print(w_right)
Is w_left stereo? False
Is w_right stereo? False
Waveform, fs=1Hz, length=2000, dtype=float64, 250 missing entries (12.5%)
[ 1.          0.99998026  0.99992104 ...,  0.99982235  0.99992104
  0.99998026]
Waveform, fs=1Hz, length=2000, dtype=float64, 500 missing entries (25.0%)
[ 0.          0.00628314  0.01256604 ..., -0.01884844 -0.01256604
 -0.00628314]
Special audio abilities
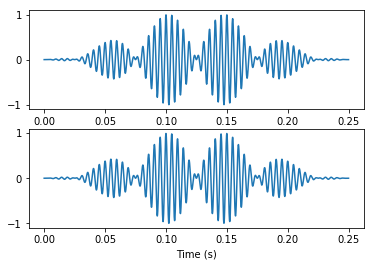
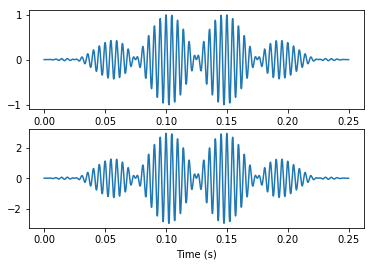
Resampling
A Waveform can be resampled using the resample method:
In [8]:
wr = Waveform(w)
wr.resample(22050)
plt.subplot(211)
w.plot()
plt.subplot(212)
wr.plot()
print(w)
print(wr)
Waveform, fs=8000Hz, length=2000, dtype=float64, 0 missing entries (0.0%)
[  0.00000000e+00   2.67312669e-06   1.02542205e-05 ...,   9.53716412e-06
   2.56356145e-06   0.00000000e+00]
Waveform, fs=22050Hz, length=5512, dtype=float64, 0 missing entries (0.0%)
[  6.52183395e-11   4.62179514e-07   1.47050857e-06 ...,   2.92574538e-07
  -5.18363220e-08  -1.00341249e-07]
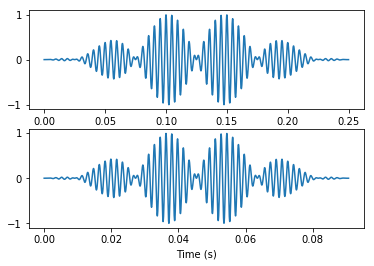
Changing the sampling frequency without resampling the waveform
In [9]:
w_fs = Waveform(w)
w_fs.fs = 22050
plt.subplot(211)
w.plot()
plt.subplot(212)
w_fs.plot()
print(w)
print(w_fs)
Waveform, fs=8000Hz, length=2000, dtype=float64, 0 missing entries (0.0%)
[  0.00000000e+00   2.67312669e-06   1.02542205e-05 ...,   9.53716412e-06
   2.56356145e-06   0.00000000e+00]
Waveform, fs=22050Hz, length=2000, dtype=float64, 0 missing entries (0.0%)
[  0.00000000e+00   2.67312669e-06   1.02542205e-05 ...,   9.53716412e-06
   2.56356145e-06   0.00000000e+00]
Intensity
A Waveform has an attribute rms giving the root mean square of the audio signal (where missing samples equal zero). It can be changed by setting a new value.
In [10]:
w_rms = Waveform(w)

plt.subplot(211)
w_rms.plot()
print('RMS before modification: ', w_rms.rms)

w_rms.set_rms(1)

plt.subplot(212)
w_rms.plot()
print('RMS after modification: ', w_rms.rms)
RMS before modification:  0.335868569998
RMS after modification:  1.0
Properties
A Waveform has several attributes that give information about the audio signal
In [11]:
print('Length: {} samples'.format(w.length))
print('Duration: {} s'.format(w.duration))
print('Time axis: {}'.format(w.time_axis))
Length: 2000 samples
Duration: 0.25 s
Time axis: [  0.00000000e+00   1.25000000e-04   2.50000000e-04 ...,   2.49625000e-01
   2.49750000e-01   2.49875000e-01]
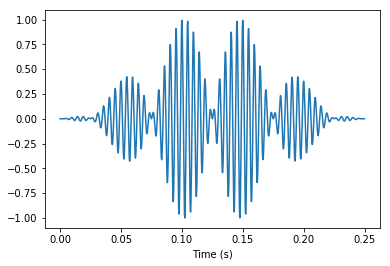
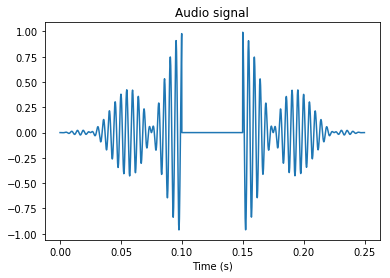
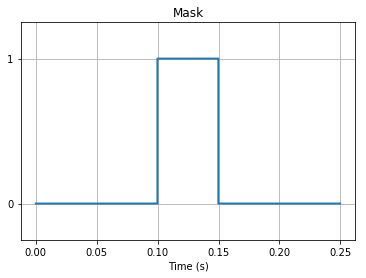
Plotting
A Waveform can be plotted, as well as the associated mask.
In [12]:
plt.figure()
wm.plot()
plt.title('Audio signal')

plt.figure()
wm.plot_mask()
plt.title('Mask')
pass
Playing sound
The sound can be played using show_player in a notebook or play in a console.
In [13]:
w.show_player()
Out[13]:
I/O
A Waveform can be exported as a .wav file using to_wavfile:
In [14]:
f0_io = 10
fs_io = 8000
x_io_len = fs_io
x_io = np.array([np.cos(2*np.pi*f0_io/fs_io*np.arange(x_io_len)),
                 np.sin(2*np.pi*f0_io/fs_io*np.arange(x_io_len))]).T
mask_io = np.zeros_like(x_io, dtype=bool)
mask_io[0, -1000:] = mask_io[1, -500:] = True
w_io = Waveform(x_io, mask=mask_io, fs=fs)
w_io.plot()
print(w_io)

w_io.to_wavfile('my_sound.wav')
Waveform, fs=8000Hz, length=8000, dtype=float64, 4 missing entries (0.0%)
[[          x           x]
 [          x           x]
 [ 0.99987663  0.01570732]
 ...,
 [ 0.99972243 -0.02355976]
 [ 0.99987663 -0.01570732]
 [ 0.99996916 -0.0078539 ]]
A .wav file can be read using static method from_wavfile, returning a Waveform:
In [15]:
w_load = Waveform.from_wavfile('my_sound.wav')
w_load.plot()
print(w_load)
Waveform, fs=8000Hz, length=8000, dtype=float64, 0 missing entries (0.0%)
[[ 0.          0.        ]
 [ 0.          0.        ]
 [ 0.99987662  0.01570732]
 ...,
 [ 0.99972242 -0.02355976]
 [ 0.99987662 -0.01570732]
 [ 0.99996918 -0.0078539 ]]

In [16]:
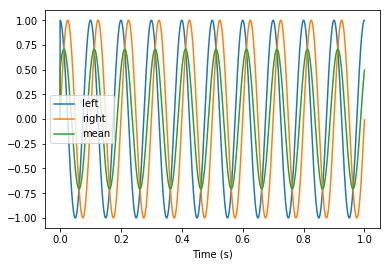
# Stereo files may be converted to mono
for mode in ('left', 'right', 'mean'):
    w_load = Waveform.from_wavfile('my_sound.wav', conversion_to_mono=mode)
    w_load.plot(label=mode)
legend()
pass
Note that:
- dtype: float/int data types are conserved when exporting a Waveform, since the .wav format allows many data types. However, many audio players only read .wav files coded with int16 values so you may not be able to listen to your exported sound with your favorite player. In that case, you may convert the data type of your Waveform using the optional dtype argument of method to_wavfile.
- mask: the mask is lost when exporting to a .wav file.
- sampling frequency: sampling frequencies may be arbitrary
floatorintvalues; however, only a restricted set of sampling frequencies are allowed for input/output (see set of supported frequencies `madarrays.waveform.VALID_IO_FSbelow).
In [17]:
from madarrays.waveform import VALID_IO_FS
print(VALID_IO_FS)
{8000, 1, 32000, 48000, 16000, 22050, 44100, 88200, 11025}
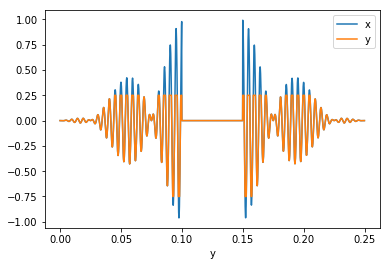
Clipping
Clipping a Waveform is done by using the clip method, taking as
arguments the minimal and maximal values. Warnings are displayed to
inform the user if any value has been clipped.
In [18]:
wm_clipped = wm.copy()

wm_clipped.clip(min_value=-0.75, max_value=0.25)

# Plot signals
plt.figure()
wm.plot('b', label='x')
wm_clipped.plot('y', label='y')
plt.legend()
/usr/local/lib/python3.6/dist-packages/madarrays/waveform.py:755: UserWarning: float64 values lower than -0.75 have been clipped.
  warnings.warn(warnmsg.format(self.dtype, min_value))
/usr/local/lib/python3.6/dist-packages/madarrays/waveform.py:761: UserWarning: float64 values greater than 0.25 have been clipped.
  warnings.warn(warnmsg.format(self.dtype, max_value))
Out[18]:
<matplotlib.legend.Legend at 0x7f230877e630>
Type of entries in Waveform
This section is for advanced usages.
Audio data can have different types, that are associated with specific constraints on the values:
- float (np.float16, no.float32, np.float64): the values are float between -1 and 1;
- int (np.uint8, np.int16, np.int32): the values are integers between a range that depends on the precision.
- complex (np.complex64, np.complex128): the real and imaginary parts are float betwen -1 and 1.
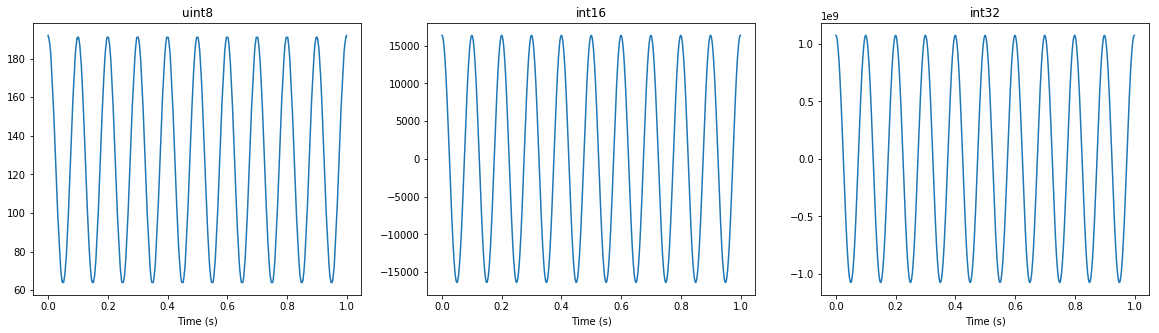
Integer-valued waveforms
Method Waveform.astype not only converts data types but also scale
values to the range of the target type. The choice among the available
integer types will result in different ranges. The following figures
show integer-valued waveforms with different types: on the first row,
waveforms created without conversion, from integer-valued data arrays
where the full dtype range is used; on the second row, similar
waveforms are created with a conversion from a float-valued array with
entries in [-1, 1].
In [19]:
fs = 1000
f0 = 10
duration = 1
t = np.linspace(0, duration, int(duration*fs))
x_cos = 0.5 * np.cos(2*np.pi*f0*t)

w_uint8 = Waveform((2**7*x_cos + 128).astype(np.uint8), fs=fs)
w_int16 = Waveform((2**15*x_cos).astype(np.int16), fs=fs)
w_int32 = Waveform((2**31*x_cos).astype(np.int32), fs=fs)

plt.figure(figsize=(20, 5))
plt.subplot(131)
plt.title('uint8')
w_uint8.plot()
plt.subplot(132)
plt.title('int16')
w_int16.plot()
plt.subplot(133)
plt.title('int32')
w_int32.plot()

w_uint8 = Waveform(x_cos, fs=fs).astype(np.uint8)
w_int16 = Waveform(x_cos, fs=fs).astype(np.int16)
w_int32 = Waveform(x_cos, fs=fs).astype(np.int32)

plt.figure(figsize=(20, 5))
plt.subplot(131)
plt.title('uint8')
w_uint8.plot()
plt.subplot(132)
plt.title('int16')
w_int16.plot()
plt.subplot(133)
plt.title('int32')
w_int32.plot()
pass

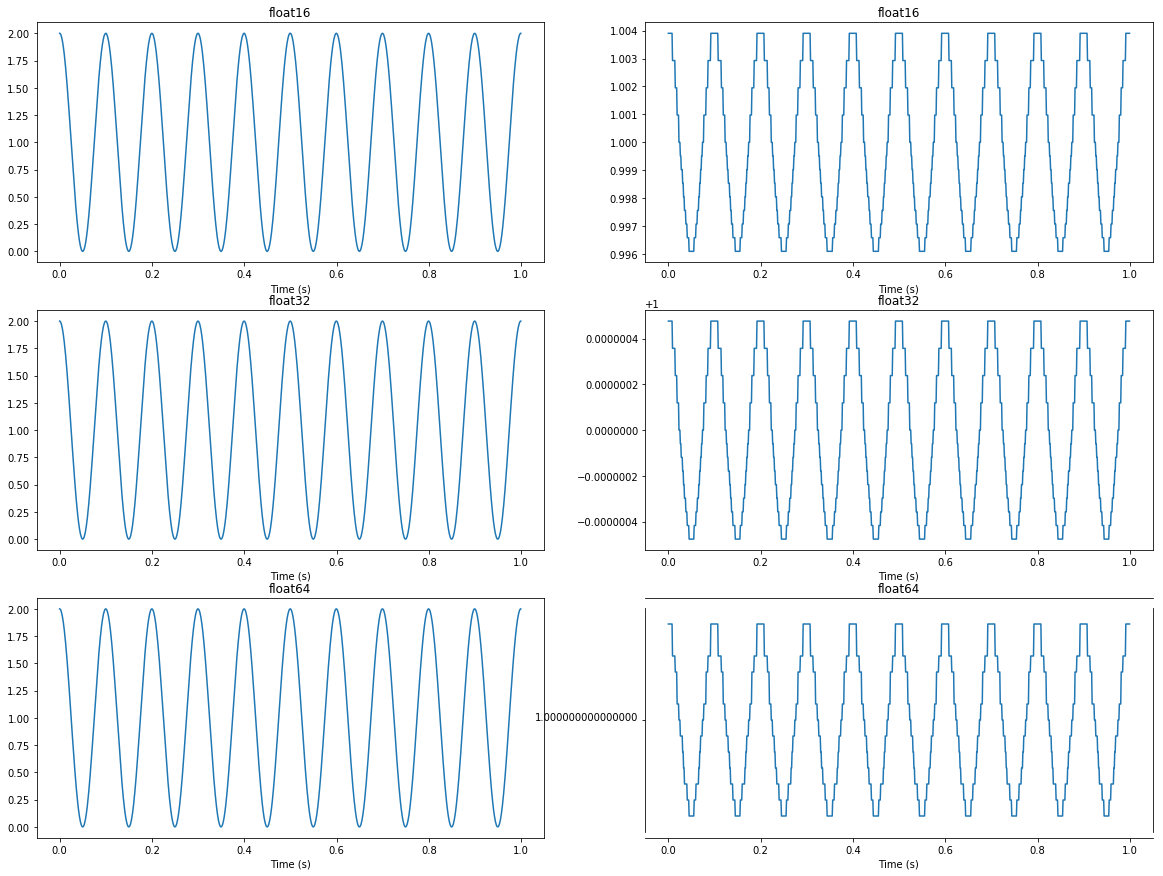
Real-valued waveforms
The choice among the available float types will not affect the range of the values but the precision. In the following example, one may observe how the floating-point precision varies, depending on the float type, when the fractionnal part is very small compared to the exponent part, which equals 1 here (see right column).
In [20]:
fs = 1000
f0 = 10
duration = 1
t = np.linspace(0, duration, int(duration*fs))

w_float16 = Waveform(np.cos(2*np.pi*f0*t).astype(np.float16) + 1, fs=fs)
w_float32 = Waveform(np.cos(2*np.pi*f0*t).astype(np.float32) + 1, fs=fs)
w_float64 = Waveform(np.cos(2*np.pi*f0*t).astype(np.float64) + 1, fs=fs)

plt.figure(figsize=(20, 15))
plt.subplot(321)
plt.title('float16')
w_float16.plot()
plt.subplot(323)
plt.title('float32')
w_float32.plot()
plt.subplot(325)
plt.title('float64')
w_float64.plot()

eps16=np.finfo(np.float16).eps * 4
eps32=np.finfo(np.float32).eps * 4
eps64=np.finfo(np.float64).eps * 4
print(eps16, eps32, eps64)

w_float16 = Waveform(np.cos(2*np.pi*f0*t).astype(np.float16) * eps16 + 1, fs=fs)
w_float32 = Waveform(np.cos(2*np.pi*f0*t).astype(np.float32) * eps32 + 1, fs=fs)
w_float64 = Waveform(np.cos(2*np.pi*f0*t).astype(np.float64) * eps64 + 1, fs=fs)

plt.subplot(322)
plt.title('float16')
w_float16.plot()
plt.subplot(324)
plt.title('float32')
w_float32.plot()
plt.subplot(326)
plt.title('float64')
w_float64.plot()
plt.ylim(1 - 1.2 * eps64, 1 + 1.2 * eps64)

pass
0.00390625 4.76837158203e-07 8.881784197e-16
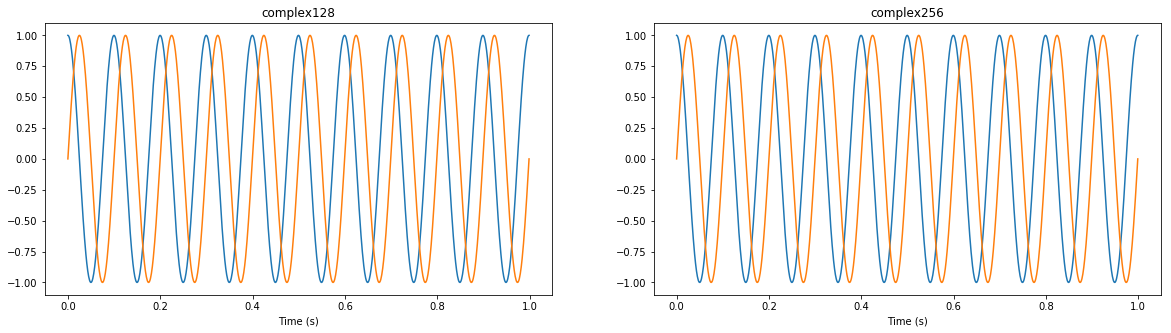
Complex-valued waveforms
In [21]:
fs = 1000
f0 = 10
duration = 1
t = np.linspace(0, duration, int(duration*fs))
w_complex128 = Waveform((np.cos(2*np.pi*f0*t) + 1j*np.sin(2*np.pi*f0*t)).astype(np.complex128), fs=fs)
w_complex256 = Waveform((np.cos(2*np.pi*f0*t) + 1j*np.sin(2*np.pi*f0*t)).astype(np.complex256), fs=fs)

plt.figure(figsize=(20, 5))
plt.subplot(121)
plt.title('complex128')
w_complex128.plot(cpx_mode='both')
plt.subplot(122)
plt.title('complex256')
w_complex256.plot(cpx_mode='both')
pass
Casting into another dtype
The casting of a waveform in a different dtype depends on the current dtype and the desired dtype:
- Integer-to-real casting is performed by applying on each entry
\(x\) the function \(f(x)=\frac{x - z}{2^{n-1}}\), where the
source integral type is coded with \(n\) bits, and \(z\) is
the integer associated with zero, i.e., \(z=0\) for a signed type
(
int) and \(z=2^{n-1}\) for an unsigned type (uint). - Real-to-integer casting is performed by applying on each entry
\(x\) the function
\(f(x)=\lfloor\left(x + 1\right) 2^{n-1} + m\rfloor\), where the
target integral type is coded with \(n\) bits, and \(m\) is
the minimum integer value, i.e., \(m=-2^{n-1}\) for a signed type
(
int) and \(z=0\) for an unsigned type (uint); - Real-to-real casting is obtained by a basic rounding operation;
- Integer-to-integer casting is obtained by chaining an integer-to-float64 casting and a float64-to-integer casting.
These constraints are only applied when calling explicitely the method
astype.
Clipping is performed for unexpected values:
- When casting to
float, values outside \([-1, 1]\) are clipped; - When casting to
int, values outside the minimum and maximum values allowed by the integral type are clipped:- \(\left[-2^{n-1}, 2^{n-1}-1\right]\) for \(n\)-bits signed integers;
- \(\left[0, 2^{n}-1\right]\) for \(n\)-bits unsigned integers.
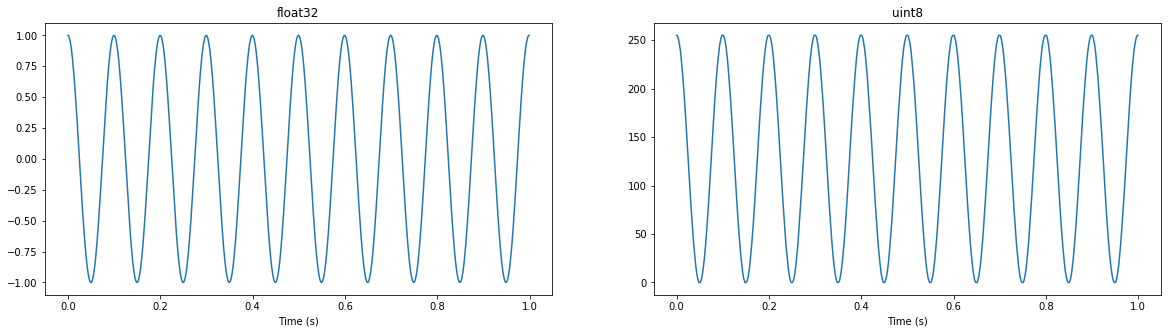
In [22]:
w_float32 = Waveform(np.cos(2*np.pi*f0*t).astype(np.float32), fs=fs)
plt.figure(figsize=(20, 5))
plt.subplot(121)
plt.title('float32')
w_float32.plot()
plt.subplot(122)
plt.title('uint8')
w_float32.astype('uint8').plot()
pass
/usr/local/lib/python3.6/dist-packages/madarrays/waveform.py:761: UserWarning: float32 values greater than 255 have been clipped.
  warnings.warn(warnmsg.format(self.dtype, max_value))